

Monitor Every AI Request.
Understand Every TokenTracked
Monitor every AI request, detect issues instantly, and optimize performance from one unified observability platform.
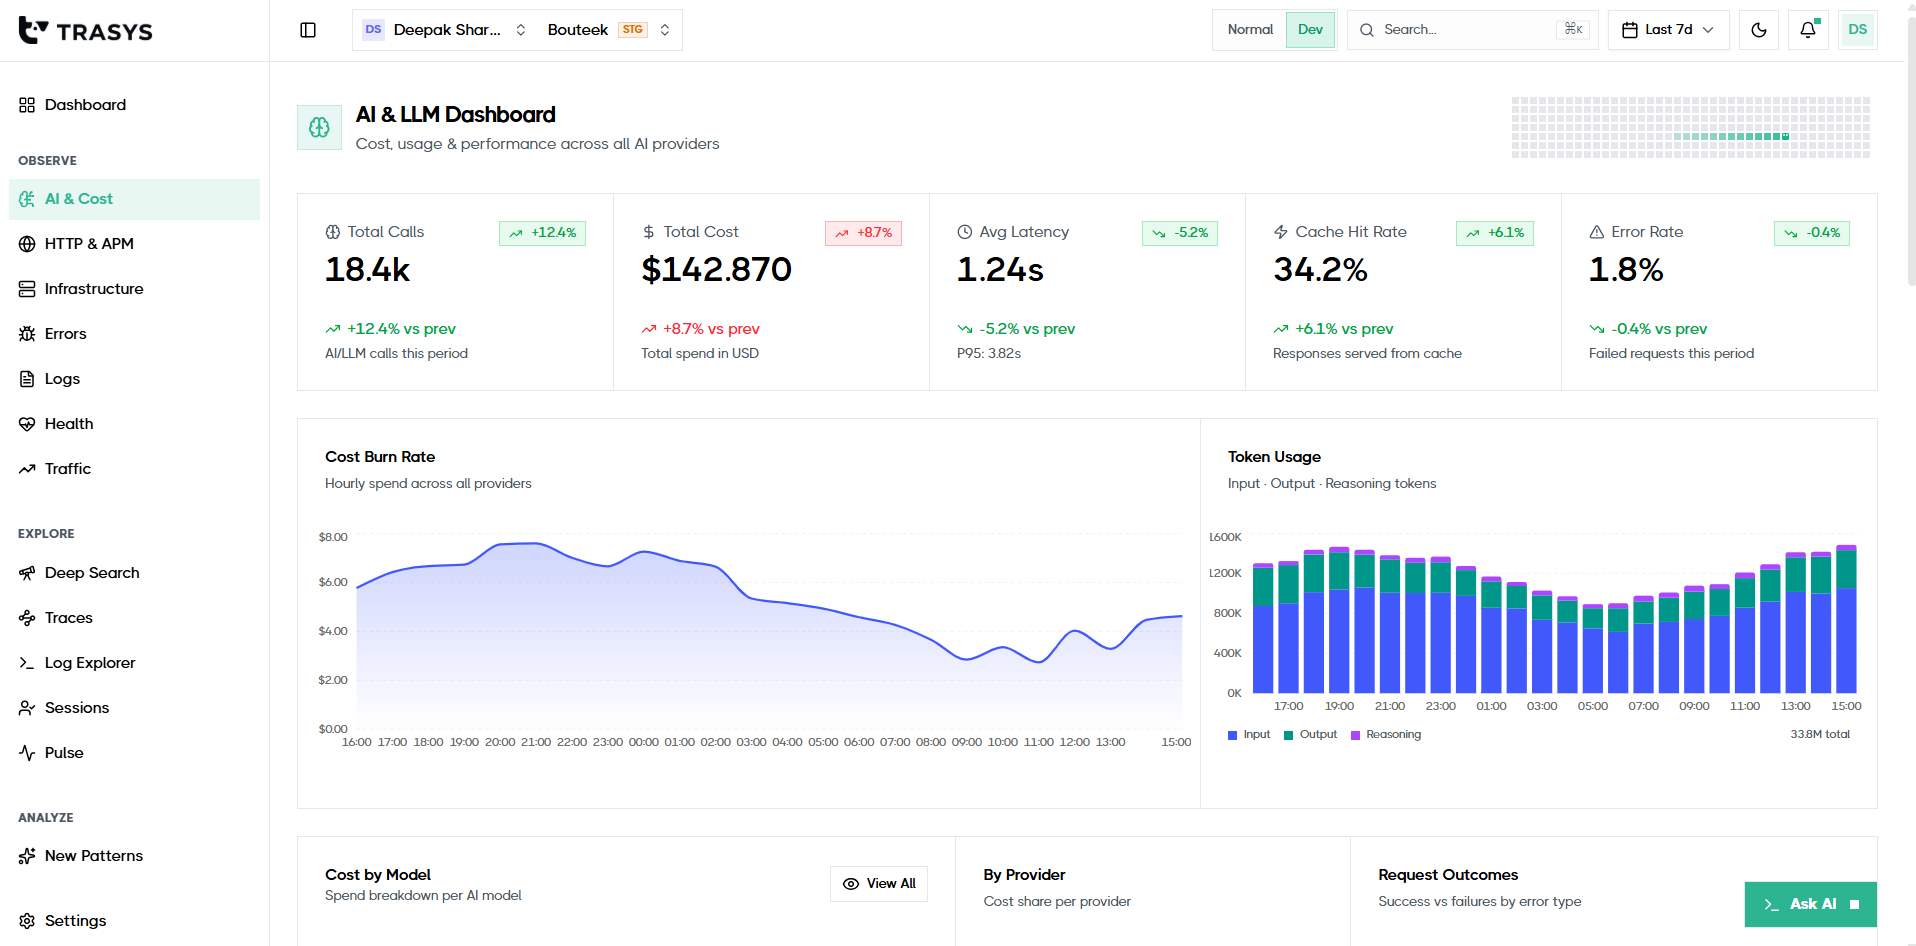
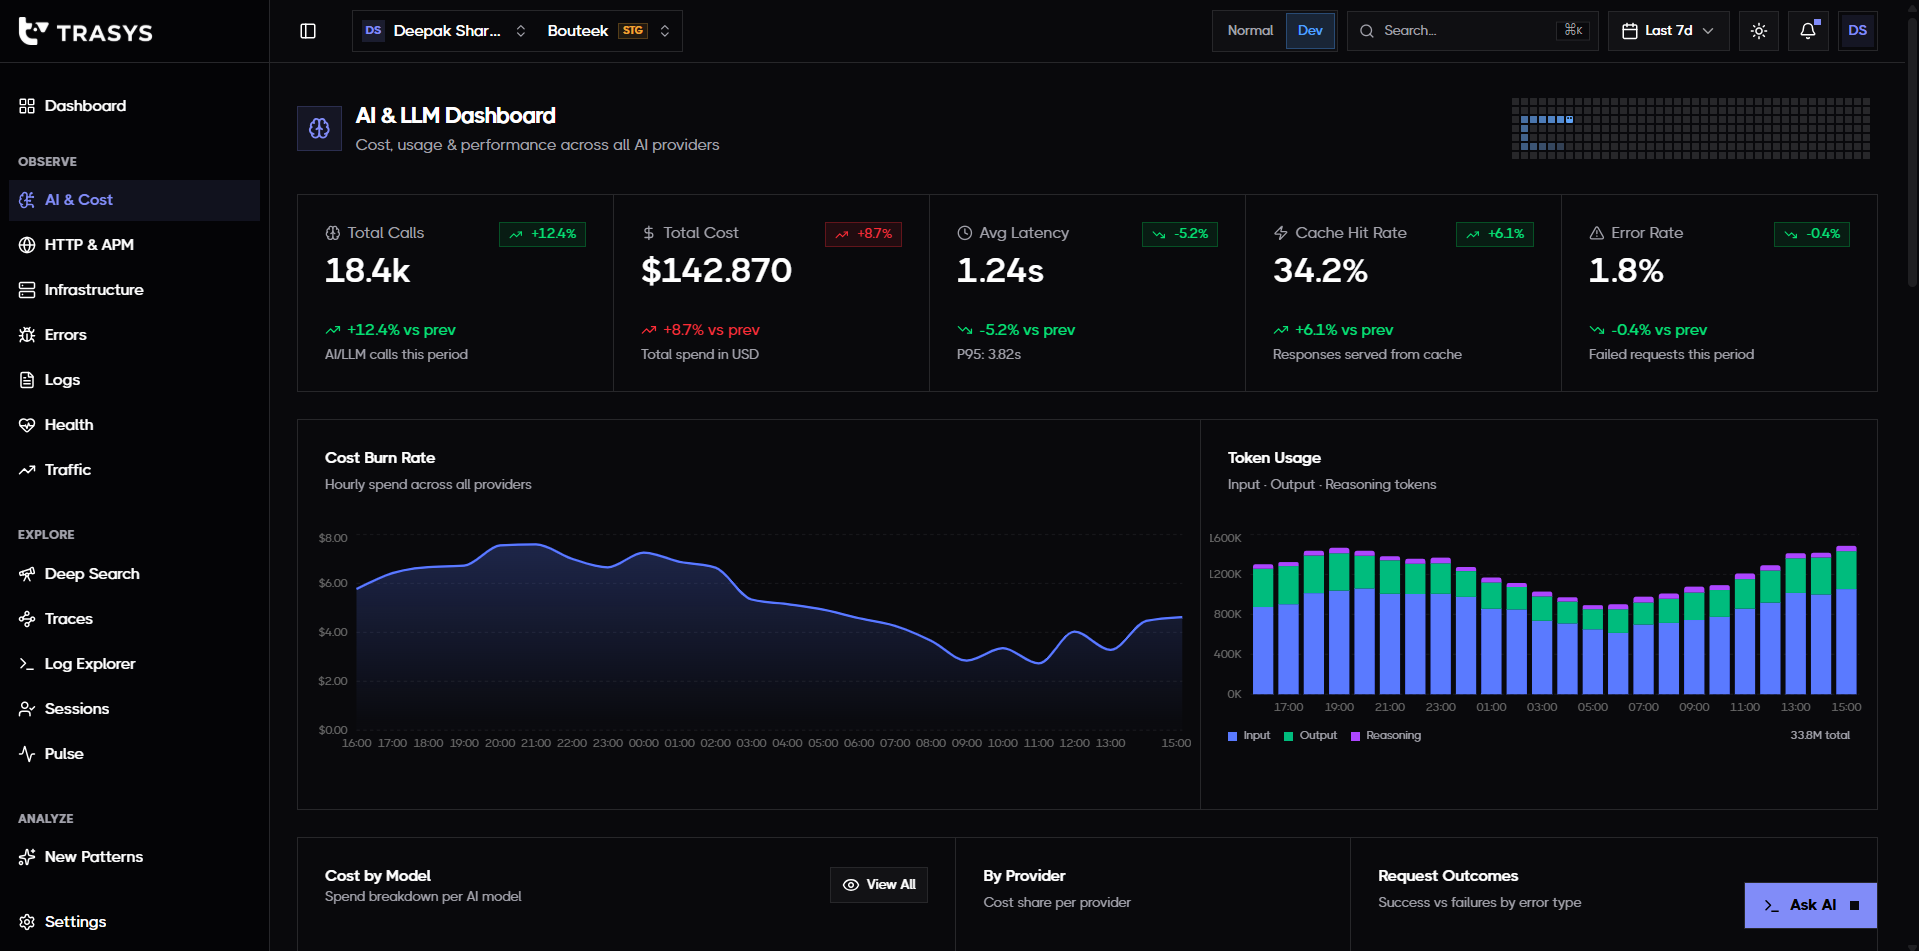
The Solution
Built to Solve Production AI Complexity
AI Cost & Safety Guardrails
Track real-time token spend, detect recurring nested execution loops instantly, and automatically trigger safety breakers before invoices spike.
Distributed Tracing Waterfalls
Track latency downstream across gateways, internal HTTP services, SQL databases, and AI models in a unified visual timeline.
Natural Language Deep Search
Query and isolate anomalous events, trace logs, or specific customer requests in seconds using an interactive AI assistant.
SELECT * FROM spans WHERE latency > 1.5sSmart Log Pattern Clustering
Reduce noise from massive logs by grouping millions of similar events into organized signatures. Locate anomalous outliers without parsing text streams manually.
Slack Ops & Escalation Workflows
Receive high-fidelity alerts directly in Slack, acknowledge or resolve incidents within threads, and route critical events via automated on-call chains.
🚨 Incident #412: High LLM latency on /api/chat
One engine.
Every layer of your stack.
Explore all featuresTQL Query Language
Query traces, logs, and metrics across ClickHouse and Postgres with one purpose-built language — no raw SQL, no per-datastore syntax to remember.
Dev & Normal Mode
Every screen has two views: Normal Mode for a plain-English summary anyone on the team can read, Dev Mode for raw payloads, spans, and query output.
Open APIs
Every metric, alert, incident, and trace is reachable through a documented REST API, so you can pipe Trasys data into your own tools and CI/CD.
Normal Mode
P99 latency spiked to 3.2s
Likely cause: slow LLM call on /api/chat
Error rate is healthy at 0.3%
All services operating normally
Dev Mode — raw span
Example Request
Ask anything.
Get answers, not dashboards.
Deep Search
Ask anything about your data in plain English. Deep Search reads across logs, traces, spans, and metrics to find the exact request, error, or cost spike you're describing — no query language required.
Ask AI
Every screen ships with an AI copilot in the corner. Ask it about what you're looking at and get an answer sourced from your live telemetry, not a canned response.
latency_logs.txt
Yesterday, 3:02 PM
Detected a massive latency spike across all EU regions. Average response time: 120ms → 840ms.
config/prompt_v18_2.json
Yesterday, 2:45 PM
Updated system prompt instructions. Added +400 tokens for formatting. Warning: may increase latency.
monitoring/alerts.csv
Yesterday, 3:05 PM
Automated anomaly detection triggered. 42 threshold alerts aggregated into a single incident report.
I found the root cause. A prompt change deployed at 2:45 PM increased average input tokens by +448, driving latency up.
Prompt version
v18.2
deployed Jun 18
Latency delta
+2,100ms
120ms → 3.2s P99
Token increase
+31.7%
1,020 → 1,468 avg
Extra spend/mo
$4,830
projected
Recommendation: revert to v18.1 or optimize the new prompt to reduce token overhead.
Never miss what matters
Get notified instantly on Slack, get a call, or escalate so your team can respond before issues impact users.
Connect Slack
Get real-time alerts posted straight to the channels your team already watches. Cost spikes, latency regressions, and error clusters show up the moment they happen, with the context you need to act.
🚨 Incident #412 opened
On it — checking traces now 🔍
On-Call Schedules
Critical incidents trigger a phone call or push notification to whoever is on rotation, so nobody misses a production-impacting issue just because they weren't staring at a dashboard.
Incoming call — Priya Mehta
Incident #412 · Critical · 10:52 PM
Priya Mehta
Backend · Mon–Wed
James Ko
Infra · Thu–Fri
Sara Lim
AI / ML · Weekend
Auto-Escalation
If an alert goes unacknowledged, it automatically escalates up the chain — from the on-call engineer to the team lead — so nothing sits unresolved while a customer-facing issue keeps running.
Escalation Timeline — Incident #412